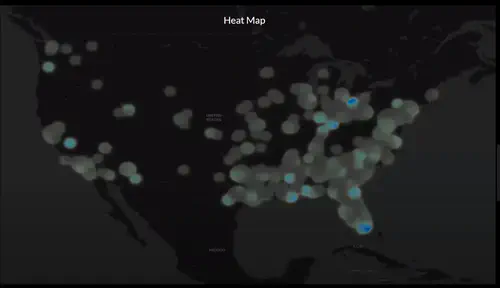
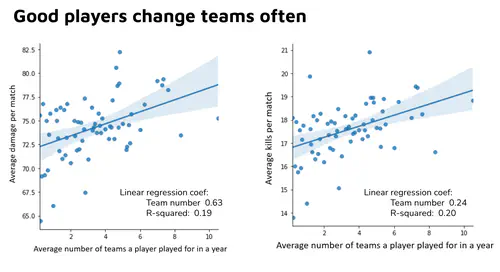
Fine-grained epidemiological modeling of the spread of COVID-19 can inform public health policy that accounts for disparities in the risk of exposure, infection, and death across different locations and different demographic groups. In Los Angeles County, disparities in COVID-19 infection rates by neighborhood have been tremendous. Throughout the current large outbreak wave, infection incidence rates in low-income, predominantly Hispanic neighborhoods of East LA have consistently been 10-15 times higher than in wealthier, predominantly white neighborhoods in West LA. Many well-informed hypotheses exist to explain the cause of these disparities in infection, including employment sectors that require leaving homes to work, household density, and behavioral differences across cultures and age groups. But for Los Angeles County, these hypotheses have not been evaluated quantitatively in the context of an epidemic modeling framework.
To explain the disproportionate impact of the virus on disadvantaged demographic groups in Los Angeles County, we are developing a networked multiple-population epidemic model to investigate how epidemic dynamics and infection outcomes differ across fine-grained neighborhoods. Specifically, we will extend an already-developed stochastic SEIR+ disease model that includes healthcare, death, and vaccination compartments into the networked multiple-population framework, which will model movements, contacts, and infection pathways within and between neighborhoods. A key feature of this modeling framework will be the use of dynamic mobility data, derived from US cell phone data, to inform changes in the daily movements of people within and between neighborhoods. This data will provide the basis of a weighted infection-transmissible contact network between neighborhoods. The SEIR disease model is run on top of this contact network, determining infection dynamics across the neighborhoods. The model will allow obtaining estimates of key epidemic quantities including transmission rates (and the time-varying reproductive number, R(t)) and infection fatality rates for each neighborhood, and identifying the neighborhoods driving epidemic spread (through contacts within and across neighborhoods). Furthermore, hierarchical modeling techniques will be used to obtain estimates of infection and fatality rates for substrata representing combinations of ethnicity/race, age, and sex within each neighborhood.
CKIDS PROJECT TASKS
While the overarching goal of this project is to develop a multiple-population epidemic model for Los Angeles County (LAC) across a network of connected neighborhoods, it is also necessary to maintain a single-population model for LAC as a whole that estimates the epidemic parameters for this larger spatial level. Such a single-population model has been maintained since May 2020 by the USC Biostatistics COVID modeling team. This model serves two important purposes. First, since May 2020 it has supported the LAC Department of Public Health, which has requested updates on key epidemic predictions on a weekly basis. Second; the parameters estimated from the single population model will serve as prior distributions in the Bayesian parameter estimation framework used in the networked-neighborhood model.
The first task for the CKIDS student will be to re-implement the parameter estimation framework for the existing LAC-level model, such that parameters are estimated each week and fixed for future estimates forward in time. This can be done either through modification to the existing code and parameter estimation framework, written in R and using Approximate Bayesian Computation (ABC), or through a full reimplementation of the modeling code. The second task will be to maintain the model estimation and website displaying updates through weekly updates using data that comes directly from the LAC Department of Public Health. A third possible task, depending on the interest of the CKIDS student, will be to apply the modeling to California data, and other counties in California (so far it has only been applied to LAC data).